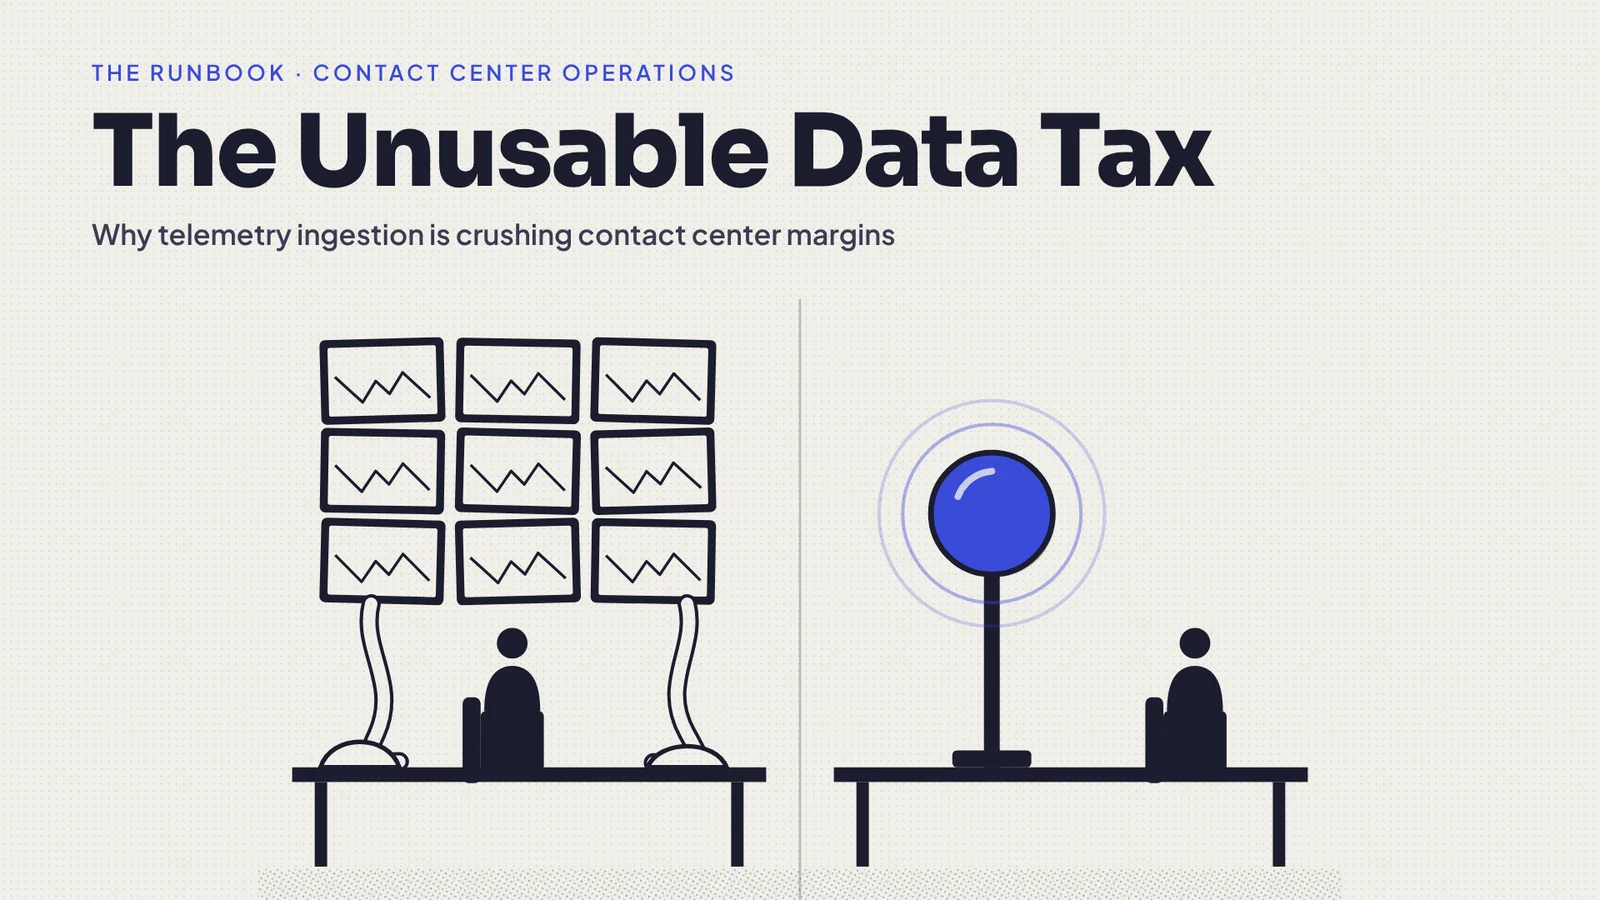
The Unusable Data Tax: Why Telemetry Ingestion Is Crushing Contact Center Margins
Operations leaders across high-volume telecommunications, internet service provision, and enterprise utilities face a severe data efficiency crisis.
To diagnose network disruptions, line latency, and hardware faults, organizations invest heavily in real-time telemetry systems. Enterprise infrastructure ingests millions of data points every second: modem signal-to-noise ratios, fiber light levels, router packet drops, and billing status flags.
On internal engineering dashboards, monitoring metrics look impressive. Data collection scales effortlessly, real-time graphs reflect continuous network activity, and system health feeds update in sub-second intervals.
Yet, when a subscriber calls to report a service outage or a degraded connection, front-line support operations still start from scratch.
Support specialists spend minutes opening multiple diagnostic tools, manually copying IP addresses, interpreting raw telemetry graphs, and asking callers repetitive troubleshooting questions. Instead of accelerating issue resolution, the massive influx of diagnostic telemetry creates cognitive overload for agents and inflates average handle times across the contact center.
The fundamental failure occurs because most enterprise infrastructure architectures collect diagnostic telemetry for network monitoring rather than structuring it for automated workflow execution.
The Operational Divide: Passive Telemetry Ingestion vs. Actionable System Triggers
When an infrastructure monitoring layer simply records telemetry data without binding it to customer account states or conversational AI engines, it transfers data-cleansing and interpretation tasks directly onto human representatives.
| Operational Dimension | Passive Telemetry Ingestion | Actionable System Triggers |
| Primary Focus | Ingesting raw network metrics into static dashboards | Translating real-time telemetry into instant account actions |
| System Access | Read-only graph views scattered across internal tools | Read/write API access to CRM, billing, and provisioning databases |
| Data Integrity | Requires manual agent interpretation mid-call | Runs pre-call automated line diagnostics and validates account health |
| Front-Office Impact | Increases average handle times and agent cognitive load | Delivers pre-diagnosed records or resolves Level 1 faults autonomously |
| Customer Experience | "Please hold while I pull up your line status" | "We identified a fiber drop in your area and initiated a line reset" |
The Three Drivers of Telemetry Waste
When enterprise diagnostic tools operate isolated from customer-facing interaction layers, three operational failure modes emerge:
1. The Diagnostic Translation Gap
Network telemetry is recorded in technical metrics like decibel drops, packet loss percentages, and latency spikes. Front-line support agents are rarely network engineers; forcing them to manually translate complex telemetry data into simple customer explanations during a live call inflates handle times and leads to misdiagnoses.
2. The Blind Handoff Penalty
When an automated voice or chat bot handles an initial subscriber contact without accessing live telemetry feeds, it asks generic troubleshooting questions ("Have you restarted your router?"). When the call escalates to a specialist, the customer is forced to repeat the same basic details, completely erasing the value of the underlying network monitoring infrastructure.
3. The Proactive Communication Vacuum
Network monitoring tools often detect local line faults or regional node outages minutes before subscribers notice a service degradation. When telemetry data remains trapped inside engineering systems, the contact center receives a sudden wave of inbound calls that could have been completely avoided through automated, proactive outreach.
The Four-Step Framework for Telemetry-Driven Operations
To transform passive network monitoring into an engine for operational speed, enterprise leadership must bridge the gap between back-office telemetry and front-office execution.
1. Bind Telemetry Directly to Customer Accounts
Do not isolate telemetry in separate engineering portals. Map real-time line health, modem metrics, and service status directly to the customer's unique account ID in the central CRM layer.
2. Convert Raw Metrics into Binary Action Triggers
Translate complex diagnostic telemetry into clear business logic rules. Instead of displaying raw decibel levels to an agent or an AI system, configure the pipeline to output simple, actionable states: "Line Normal," "Local Outage Detected," or "Hardware Replacement Required."
3. Feed Diagnostic Telemetry into First-Turn AI Logic
Ensure conversational voice and chat engines pull live account telemetry the moment a customer initiates contact. When a subscriber reaches out during an active outage, the system should immediately acknowledge the specific network fault without asking the user to describe the problem.
4. Enable Automated System Remediation
Grant AI communication channels write-access permissions to execute common technical fixes based on incoming telemetry signals. If diagnostic data confirms a line synchronization error, the system should automatically trigger a line re-authorization or port reset instantly without requiring human intervention.
Turning Data into Operational Velocity
Collecting millions of network data points offers zero commercial advantage if it does not simplify the customer experience. True operational efficiency requires communication infrastructure that does not just monitor network health, but translates telemetry directly into instant, autonomous issue resolution.
At GoZupees, we design purpose-built AI agents for Voice, Chat, and Email engineered for high-volume telcos, ISPs, and enterprise contact centers. Our communication layer integrates directly into core CRM, billing, and diagnostic infrastructure, eliminating hold times, resolving Level 1 workflows autonomously, and maintaining complete context across every customer touchpoint.
Ready to turn your network telemetry into autonomous workflow execution? Visit www.gozupees.com to schedule a live operational demo with our team.